

Big Data, is it the new gold?
Currently, data has become a fundamental aspect for companies, not only to get to know its customers and preferences, but also to optimize its business processes and acquire better results through advanced analysis tools.
The collection of data and the trends that are established make it possible for companies to identify different aspects quickly and efficiently, generating solutions in problem areas that may affect companies in the future.
In the last year, it has come to my attention that several companies have found themselves with new consulting projects to build a data warehouse, allowing them to get the most out of their data. The prior because the already established data warehouses or projects do not allow enterprises to answer the business questions posed in order to anticipate market and consumer changes.
The main obstacle some companies face when modernizing their existing data analytics platform is giving up on a single database that is being used in its ERP (Enterprise Resource Planning) and its BI (Business Intelligence), which makes it difficult to divest after the substantial investments made for their development and operation. Over the past few years I have met and worked with companies that spent millions of dollars and several years of development to build their data warehouse and the numerous ETL (Extract, Transform, Load) processes, they have also invested in stored formulas and reporting tools that are part of said process. As a result of the aforementioned, it is important to understand the benefits of having a single tool when it comes to providing answers to the business regarding “Where is the data for the analytics I need?”.
Companies that are succeeding in finding benefit with “analytics” are understanding that data should not be organized across tables or harmonized to have the same format since harmony is not essential for the DAP (Data Analytics Platform) to be flexible enough to deliver results.
Is it advisable to invest more in the DAP? The data platform we are talking about is essential in the digital transformation supporting the AI (Artificial Intelligence) of every company that wants to stay relevant and competitive today, which is why each analytical use case should have its own dedicated and independent data flow, even if that means that the data might be replicated dozens of times and calculated differently.
It should be considered that for each use, data is analyzed from a different angle depending on the business’ need, and eventually, this is developed by a different team. This is why sales analysis is different from marketing analysis or logistics analysis.
The most common mistake made by companies when trying to do analytics is to focus on the data rather than the business problem at hand. Consider, for example, a logistics company that has equipped its fleet of trucks with GPS technology. Such system will generate data showing the precise movements of each vehicle. However, what the company needs is data analytics to help it optimize its delivery routes. In order to this problem, we need totally different data, such as demand, where the consumer is shopping, data that is not generated by the company itself, and inventory levels in the stores over time.
For example, in the first semester of this year, with the analytics team of one of the most important CPG (consumer packaged goods) companies in Colombia, we analyzed how with the new changes in consumer behavior, a store that before the pandemic had a daily frequency of attention, now had a drop in sales; a significant budget was invested to reactivate the demand, but sales did not react positively.
Since this store is located near educational centers and government offices, a consumer who used to visit the store 5 or 6 times a week to buy a coffee in each visit, now only visits the store 2 or 3 times a week, given that the person can now do the daily tasks remotely or from home, therefore, no longer needing to go there, costumers went from purchasing 5 or 6 beverages to only 3.
How can we recover the other 3 drinks that the person stopped consuming? or where is the person consuming them now? Are they buying them physically or buying them online? In the data repository that the company we worked for developed, it became evident that it did not have enough data to answer the aforementioned questions, so it was necessary to look for external data, such as: Where are online purchases being generated? Where are digital transactions moving to in order to understand the new purchasing and consumption patterns? among others; we face a challenge without historical data to analyze and predict it.
With the above we can assert that we should not use a single data warehouse, as it will eventually limits our ability to increase the use of them, we must also learn, test, and adopt new tools and technology, so it is important to work this issue with the bosses, especially with those who get stressed, requesting all kinds of metrics or statistics and then doing nothing with them.
Below, I explain the diagram illustrated above, on how an easy-to-implement and scalable DAP should look like.
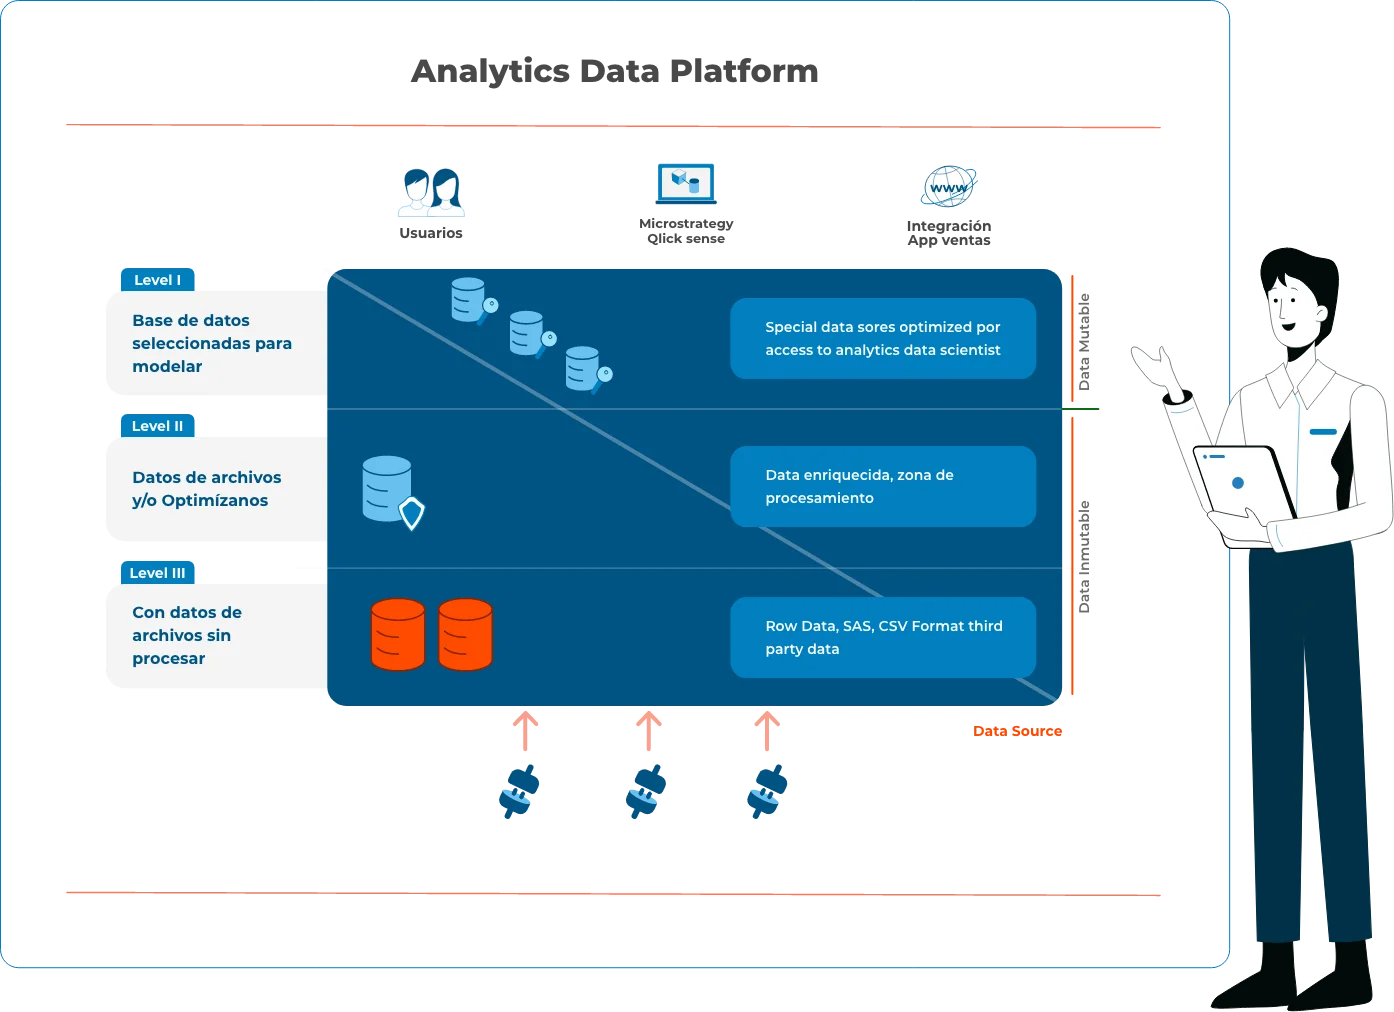
Diagram adapted from the one designed by: Guy Ernest, co-founder and CTO of @Aiola, an AI company serving large enterprise AI transformation in the cloud. Guy is an ML-Hero of AWS.
Level I (L1): Raw data in low-cost storage
All data should land in its raw form from each source with little modification or filtering, these may come from IoT (Internet of things) devices, streaming feeds such as Kafka or Kinesis, textual log files, or web service interactions, images, videos, textual comments, Excel or CSV files from trading partners, or anything desired for analysis and learning.
Therefore, data should NOT be organized between tables, or harmonized to have the same format as the address or product ID, harmony is not part of level I, and this is fundamental for the system to be flexible enough to grow.
Level II (L2): Clean and/or optimized file data
The second level is gradually built from the data entering in the first level. It starts as soon as the file lands on the first level and evolves as more and more data is entered. The evolution will be driven by the availability of data, and mainly by the commercial use of data analysis, such as Churn forecasts or BI reports.
At this level it is important to consider two aspects:
Multiple use cases: each analytical use case should have its own dedicated and independent data flow. Even if that means that the data will be replicated dozens of times and calculated differently, it is important to ensure that each analytical use case has its own dedicated data flow.
Data derivatives: data at the second level are aggregated, filtered, or transformed mainly from their original raw form to fit a specific business question. If it is necessary to predict a brand’s daily sales, it is not necessary to analyze each individual purchase for each unique product. I can see the daily and the brand aggregation. We should not be afraid to make the derivative “Too Specific”, since we still have the raw data at Level I. We will have many other specific derivatives for the other business use cases. Having the “same” data in different forms is not a problem, since it is not the same data, but a derivative of it.
This data is recommended to be hosted in low cost storage such as AWS S3 or Azure Blob, in that way it is possible to keep dozens of “copies” of the big data that companies have, each “copy” of this data should have a very low cost.
Level III (L3): Database selected for modeling
To enable user interactions with data analysis results, it is often necessary to store these results at this level so that they can be used by work teams in terms of speed and consulting capabilities.
These “clean” data are commonly stored in a relational database (such as MySQL or Aurora PostgreSQL), which may be fine for relatively small datasets and visualization or BI tools that can work with them.
This level is much more expensive than the first two in terms of data storage and is therefore used only for actual user use cases, and can be recreated or removed as needed, the flexibility and cost-effectiveness to build analytical use cases within the organization will be available. It takes time to transform businesses to become “smarter” and use data more efficiently, and this time must be planned around agility, cost, scale, and simplicity.
Operation: Orchestration and Monitoring
Running these 3 level, multiple use cases, lines of business, data warehouses and other multipliers is not something that can be done manually with a single DBA or even a team of DBAs, in many companies, DevOps (development operations) practices have already begun to evolve, and capabilities around microservices, containers and continuous integration are already emerging.

The migration to the cloud is also of interest in some companies, in more advanced companies it might be a plan, contributing to democratize the use of data from IT. However, the ability to do DataOps (Data operations) efficiently is difficult and new for most organizations. The design of an agile and evolving architecture of the new infrastructure must include an essential aspect of people skills and the choice of the right tools to automate data handling in general.
Today more than ever, and in the future even more so, analytics shows us the way to determine the best operations: That is to say, “moving from the economics of intention to the economics of action”, but ¿How can a company get the most out of “analytics” and what myths should be cleared up about this concept?
This Data Analytics Platform is an essential part of the digital transformation and artificial intelligence of every company that aims to stay relevant and competitive nowadays, looking into the data of the past is not like managing the future, the problem is that there is no certainty that what happened will happen again, therefore, it is difficult to predict when something is born out of nothing.